Your car's CO2 emissions: what does it really emit, and what does Euro 6 mean?
· 10 min read
Two cars with the same CO2 figure in the register can differ by hundreds of kilos a year on the road. That figure was measured on a test bench, under conditions you never drive in. And the label everyone talks about, Euro 5 or Euro 6, says nothing at all about CO2.
This guide explains how to work out a car's real CO2 emissions, how to check them on a car you want to buy, how to follow your own car month by month, and what emission classes do mean for low-emission zones and your wallet. It describes the Dutch market: the register, taxes and zones are Dutch.
In short
- The register gives a test-bench value. On the road, consumption is on average 20.4% higher for petrol and 16.7% for diesel (WLTP), and up to around 40% for older NEDC cars.
- A litre of petrol causes about 2.8 kilos of CO2, a litre of diesel over 3.2 kilos, fuel production included.
- An average Dutch petrol car causes about 2.35 tonnes of CO2 at 12,000 kilometres a year, around 196 grams per kilometre.
- An electric car comes to about 570 kilos over the same distance on the average Dutch grid, and around 35 kilos on green power.
- The Euro norm (Euro 5, Euro 6) is not about CO2 but about harmful substances such as NOx and particulates. It does decide whether a diesel may enter a low-emission zone.
- Checking is free: per plate in the CarCheck report, and month by month for your own car in My garage.
What the CO2 figure in the register does and does not tell you
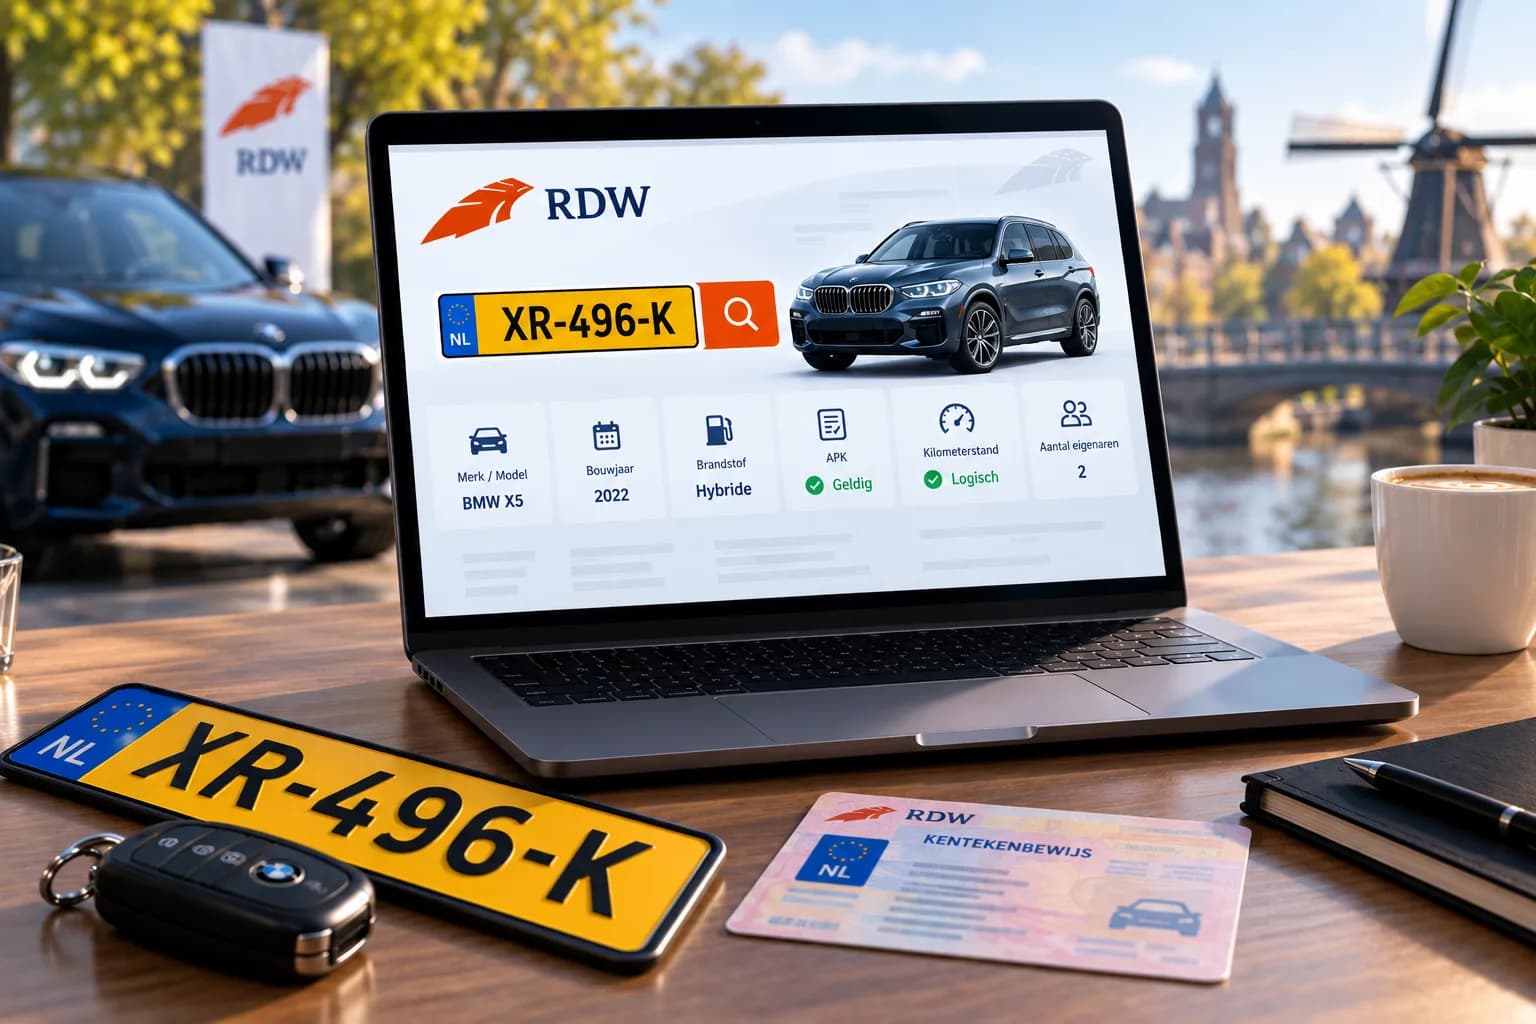
Every car receives a CO2 figure in grams per kilometre at type approval. The RDW (the Dutch vehicle authority) copies it into the register, and the BPM (the Dutch purchase tax on cars) is calculated from it. But it comes from a laboratory, not from the road.
For older cars that is the NEDC test: a gentle drive with the air conditioning off and everything else that flattered the result. Since September 2018 every new car has had to pass the stricter WLTP test. It is closer to real driving, but still not there.
How big the gap is, we now know precisely. New cars log their real consumption with an on-board meter, and the European Commission has collected that data. For cars registered in 2021 real consumption was on average 20.4% above the WLTP figure for petrol and 16.7% for diesel. For NEDC cars the gap is larger, up to around 40% for the last model years before WLTP.
Something else is missing too. The register counts only what leaves the exhaust. Extracting, refining and transporting the fuel adds almost a third on top. Count that, and every litre of petrol causes about 2.8 kilos of CO2, and every litre of diesel over 3.2 kilos.
How CarTrace works out the real emissions
We start from the figure the car is registered with and correct it in three steps. Every step is a published figure with a source, so you can trace it yourself.
- From test bench to road. A WLTP car gets the gap the EU measured; an NEDC car gets the gap established for its model year.
- From exhaust to source. Using the official Dutch emission factors from co2emissiefactoren.nl, the list Dutch companies report their emissions with, we add the production of the fuel or electricity.
- From grams per kilometre to kilos a year. Using your kilometres: a slider in the report, or the odometer readings you enter in your garage.
Nothing comes out of an electric car, but something does come out of the power station. So you choose the electricity source: green power, your own solar panels, the average Dutch grid or grey power. Even wind and solar carry a small footprint from building the turbines and panels, so green power is low, not zero.
A plug-in hybrid gets a range instead of a single figure. The low end is the type approval, which assumes you charge every day. The high end is how plug-ins are actually driven in Europe: about 6.1 litres per 100 kilometres on average, against 1 to 2 litres on paper.
Not included: building the car itself. For an electric car the battery weighs heavily there, so compare driving with driving, not a whole car's life with one year.
Four examples at 12,000 kilometres a year
For comparison: the average Dutch petrol car causes about 2.35 tonnes of CO2 over that distance, fuel production included.
- Petrol, 120 g/km under WLTP: about 2.0 tonnes a year, 13% below average.
- Petrol, 150 g/km under WLTP: just over 2.5 tonnes, 8% above.
- Diesel from 2014, 110 g/km under NEDC: about 2.2 tonnes. Cleaner than the 120 g/km petrol car on paper, not on the road.
- Electric, 16 kWh per 100 km: about 570 kilos on the average Dutch grid, around 35 kilos on green power.
Checking the CO2 of a car you want to buy
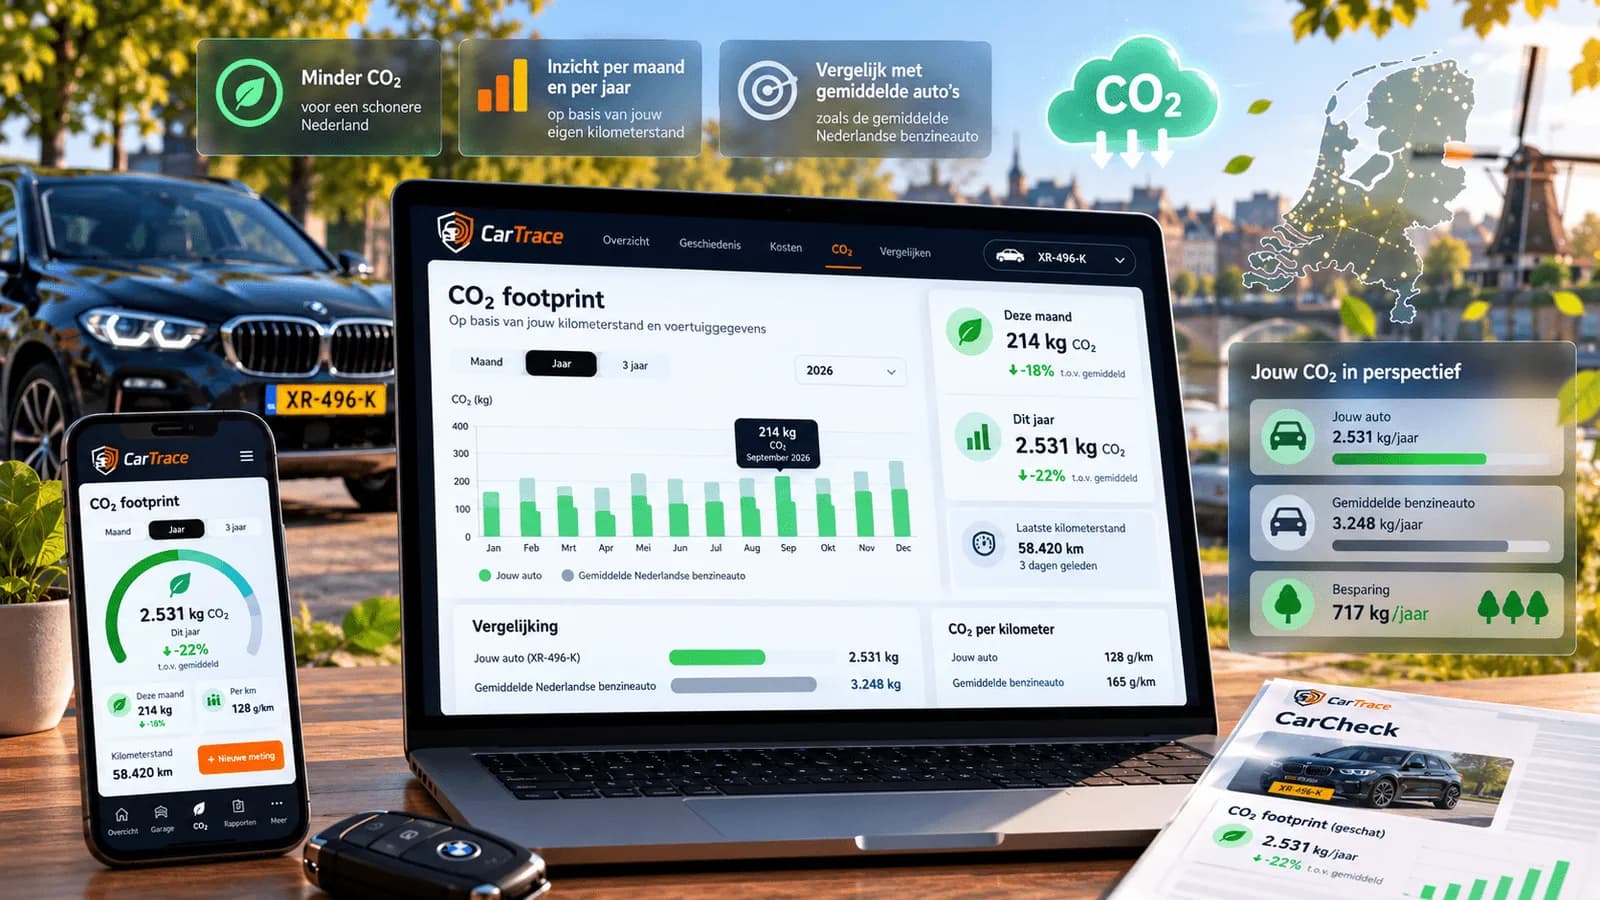
If you are about to buy a car, you want to know this before the test drive, not after. Every CarCheck report has a CO2 section, free: the estimated emissions per year, where they come from (exhaust, fuel production or electricity) and how the car compares with the average Dutch petrol car.
If you drive more or less than 12,000 kilometres a year, move the slider to your own mileage. For an electric car or plug-in you also pick the electricity source. The figure changes at once, so you see what a car means for your use. Torn between two cars? Put them side by side in the comparison; it shows the CO2 for each.
When comparing, watch three things:
- The basis of the estimate. WLTP is the most reliable; NEDC is further from the road. If the register has no consumption figure, we use a typical figure for this kind of car and say so.
- The range on a plug-in. If you will not charge every day, work with the high end.
- Fuel costs move with it. More CO2 means more litres, which is why the report puts the CO2 directly under what the car costs per month.
Enter a Dutch plate and see the estimated CO2 per year, next to emission class, APK (roadworthiness test) status, odometer judgement, recalls and theft status.
Check a plate's CO2Following your own car, month by month
An estimate at 12,000 kilometres is an average. To know what your own car emits you need your own kilometres, and they are nowhere to be found: the public register does not publish your odometer readings.
That is why the CO2 in My garage works from the readings you enter yourself. Add your car, note the odometer now and then, and CarTrace works out the emissions per month and per year, up to three years back.
- Measured months lie between two of your readings. They are as precise as your odometer.
- Estimated months are filled in from your driving pace, and the chart shows which ones they are.
- The dashboard shows each car's CO2 this month and this year, along with how old your last reading is. Adding a new one is a single tap.
- Every month sits beside what an average petrol car would have emitted over the same distance.
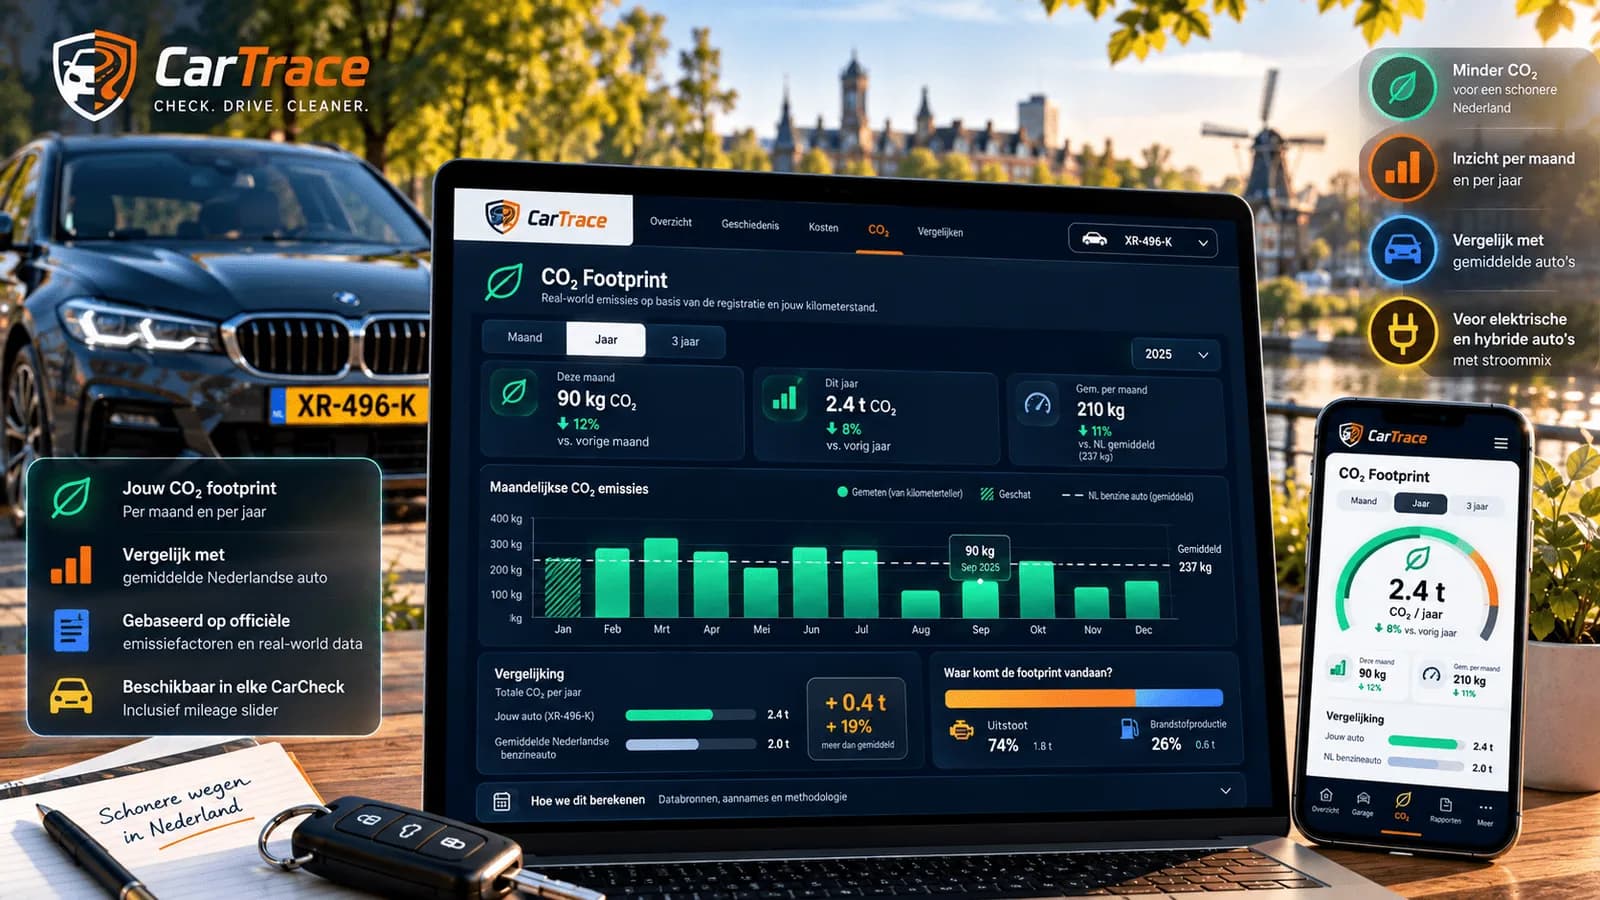
One reading a month is enough to make the whole chart measured. The same readings also show how much you really drive, which helps with a lease contract that has a mileage limit, and later when you sell.
Add your car to your garage and see its CO2 per month and per year. Free for one car.
Go to My garageEuro 5, Euro 6, Euro 7: what does the emission class mean?
Now the label that causes the most confusion. The Euro norm, called the emission class in the register, is not about CO2. It limits the substances that harm whoever breathes them in: nitrogen oxides (NOx), particulates, carbon monoxide and unburnt hydrocarbons. That is about the air in your street. CO2 is a greenhouse gas, and how much a car emits depends mostly on how much fuel it burns.
Each new norm was stricter. A car falls under the norm it was approved to, and as a rule of thumb for the date of first registration:
- Euro 1 and 2: from 1992 and 1996. The catalytic converter became standard on petrol cars.
- Euro 3: from 2000. A diesel could still emit 500 mg of NOx per kilometre.
- Euro 4: from 2005. Diesel NOx down to 250 mg/km.
- Euro 5: from 2009 for new models, 2011 for all new cars. The particulate limit of 5 mg/km made a particulate filter on diesels standard in practice. Diesel NOx: 180 mg/km.
- Euro 6: from 2014 and 2015. Diesel NOx down to 80 mg/km; petrol stayed at 60. After the 2015 diesel scandal an on-road test was added: Euro 6d-TEMP for all new cars from September 2019, Euro 6d from January 2021.
- Euro 7: for new models from 29 November 2026, for all new cars a year later. Exhaust limits for passenger cars stay largely those of Euro 6, but limits on brake dust are added, along with requirements on how long an electric car's battery lasts.
For a car from a transition year the model year does not tell you enough. Look at the register: it holds the class the car was approved to, and so does every CarCheck report.
Why Euro 6 does not automatically mean less CO2
A heavy Euro 6 petrol SUV can emit more CO2 per kilometre than a small twenty-year-old Euro 4 petrol car. The SUV is cleaner for the air in town; the small car burns less fuel. Both are true at once. Diesels are the same: often less CO2 per kilometre than a comparable petrol car, but an older diesel emits far more NOx and particulates.
So look at both: the emission class for air quality and low-emission zones, the CO2 for the climate and your fuel bill.
Where you meet the emission class in the Netherlands
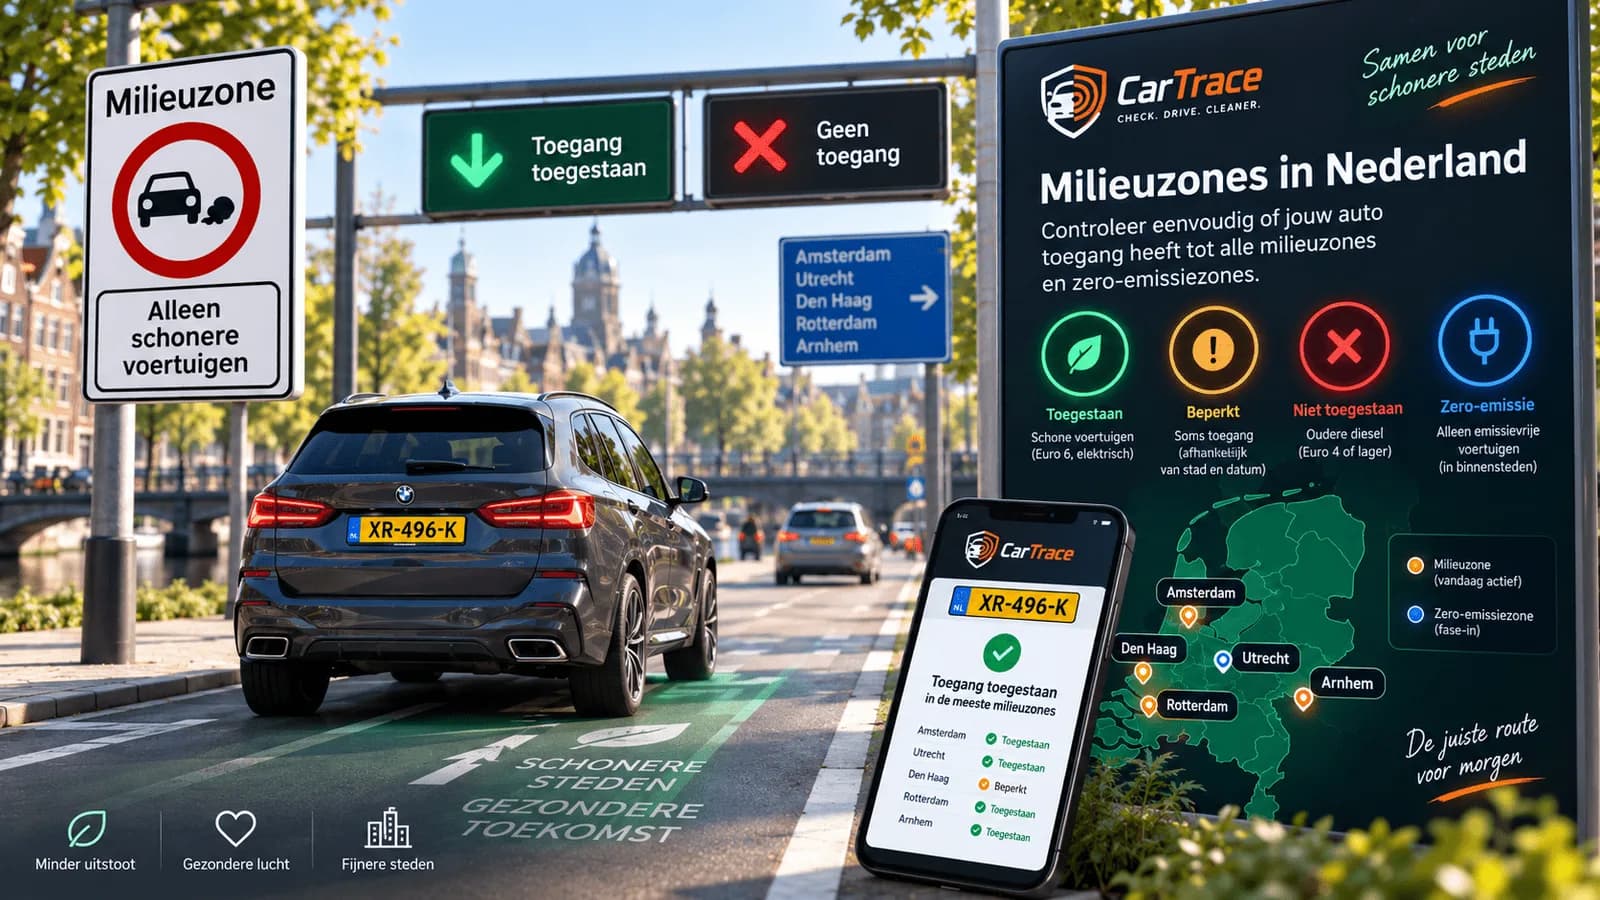
- The milieuzone (low-emission zone). Only diesels are refused, by emission class. In a green zone diesel cars from Euro 4 may enter, in a blue zone from Euro 5. Everything about the zones is in our guide to low-emission zones in the Netherlands.
- The MRB (Dutch road tax). A diesel emitting more than 5 mg of particulates per kilometre pays a 19% particulate surcharge. If the register has no particulate figure and the car was first registered before 1 September 2009, the surcharge applies too. In practice it hits diesels without a factory-fitted particulate filter. The road tax estimate in the CarCheck report includes it.
- The BPM. It is calculated from the type-approval CO2 figure, not from the emission class. One of the few places where the test-bench figure costs money directly.
- Resale value. Zones get stricter, not looser. A diesel with a low emission class will be welcome in fewer cities in a few years' time, and you will notice when you sell.
Less CO2 without buying another car
- Charge your plug-in every day. For a typical plug-in at 12,000 kilometres a year that saves almost a tonne of CO2 compared with driving it the way the European average does.
- Choose your electricity. With green power or your own solar panels an electric car's emissions drop to a fraction of those on the average grid.
- Drive fewer kilometres. It sounds obvious, but it is the one lever that works for every car: emissions scale one to one.
- Mind tyre pressure and driving style. Soft tyres, hard acceleration and high motorway speeds all sit in the gap between test bench and road.
The CO2 figure in the register tells you how the car drove on the test bench. What it emits for you depends on your kilometres. That is why we calculate with yours.
Sources: co2emissiefactoren.nl (2026 list), European Commission COM(2024) 122 on real-world fuel consumption, ICCT "From laboratory to road", Ariadne/ifeu (2025) on plug-in hybrids, Regulation (EU) 2024/1257 (Euro 7) and the Dutch Motor Vehicle Tax Act 1994. Last checked on 25 September 2026.
Frequently asked questions
›How do I look up my car's CO2 emissions?
The type-approval figure is in the RDW's public vehicle data and in every CarCheck report. It is a test-bench value. CarCheck turns it, for free, into an on-road estimate per year, including the production of the fuel or electricity, with a slider for your own mileage.
›Why are real CO2 emissions higher than the figure in the register?
The register shows a laboratory test. According to on-board measurements in European cars, real consumption of WLTP cars is on average 20.4% higher for petrol and 16.7% for diesel, and more still for older NEDC cars. The register also counts only the exhaust, not producing and transporting the fuel.
›What is the difference between Euro 5 and Euro 6?
Euro 6 is stricter on nitrogen oxides, above all for diesels: 80 mg per kilometre against 180 mg under Euro 5. The particulate limit stayed practically the same. The Euro norm says nothing about CO2; that depends on consumption.
›Does a Euro 6 car emit less CO2 than a Euro 4 car?
Not necessarily. The Euro norm limits harmful substances such as NOx and particulates, not CO2. A heavy Euro 6 car can emit more CO2 than an economical older one. Look at both: the emission class for air quality and low-emission zones, the CO2 for the climate and fuel costs.
›How much CO2 does an electric car emit?
Nothing from the exhaust, but some when the electricity is generated. At 12,000 kilometres a year and 16 kWh per 100 kilometres that is about 570 kilos on the average Dutch grid and around 35 kilos on green power. Building the car and its battery is not included.
›When does Euro 7 start?
Euro 7 applies to new types of passenger car from 29 November 2026 and to all new passenger cars from 29 November 2027. Exhaust limits stay largely those of Euro 6; new are limits on brake dust and requirements on battery durability.
›How much CO2 does an average car emit per year?
An average Dutch petrol car causes about 196 grams of CO2 per kilometre, fuel production included. At 12,000 kilometres a year that is about 2.35 tonnes. An economical petrol car comes to around 2 tonnes, an electric car on the average grid to under 0.6 tonnes.
›How do I find out which Euro norm my car has?
The emission class is in the RDW's public vehicle data and in every CarCheck report. The model year gives a rough guide (Euro 5 from 2009 to 2011, Euro 6 from 2014 to 2015), but for a car from a transition year only the register is certain.
›How much CO2 does a litre of petrol produce?
From the exhaust, about 2.1 kilos per litre of petrol and almost 2.5 kilos per litre of diesel. Add extracting, refining and transporting the fuel and it is about 2.8 kilos for petrol and over 3.2 kilos for diesel. These are the official Dutch emission factors for 2026.
Check any VIN or licence plate for free.